Toronto Real Estate Board President Larry Cerqua announced that Greater Toronto Area REALTORS® reported 8,014 residential sales through TREB’s MLS® System in February 2017. Despite the fact that February 2016 had one more day due to the leap year day, this result was up on a year-over-year basis by 5.7 per cent compared to 7,583 sales reported last year.
“The February statistics tell me that many Greater Toronto Area households continue to view home ownership as a great long-term investment. The high demand for ownership housing we’re seeing is broad-based, with strong sales growth for most low-rise home types and condominium apartments. This makes sense given the results of a recent consumer survey undertaken for TREB by Ipsos, which found an even split between intending first-time buyers and existing homeowners who indicated that they were planning on purchasing a home in 2017,” said Cerqua.
According to the recent Ipsos survey of intending GTA home buyers, first-time buyers will continue to account for much of the demand for ownership housing in Toronto and the surrounding regions. For the GTA as a whole, 53 per cent of likely buyers indicated that they would be first-timers – up from 49 per cent a year earlier. First-time buying intentions were highest in the City of Toronto, where 64 per cent of likely home purchasers indicated they would be first-timers – up from 56 per cent a year earlier. The higher percentage of first-time buyers in the City of Toronto likely relates to the prevalence of condominium apartments, which are a popular entry point into home ownership.
“There has also been much speculation, both in the media and among government policymakers, about the amount of foreign buying activity in the GTA. A recent Ipsos survey of the TREB membership on foreign buying activity suggests that the impact of foreign buyers in the GTA marketplace has been somewhat overblown. GTA-wide, the number of transactions accounted for by foreign buyers was less than five per cent. Furthermore, the great majority – 80 per cent, to be exact – of foreign buyers were purchasing a home as a primary residence, a home for another family member to live in, or as an investment to rent out to a tenant, which is helpful in a tight rental market,” continued Cerqua.
“To date, the provincial government and municipal governments have resisted the implementation of a foreign buyer tax in the absence of empirical evidence. The Ipsos survey of TREB Members should further solidify the argument that the solution to strong rates of price growth and related affordability concerns lies not with taxing foreign buyers more, but rather with addressing the supply of homes available for sale, or lack thereof,” added Cerqua.
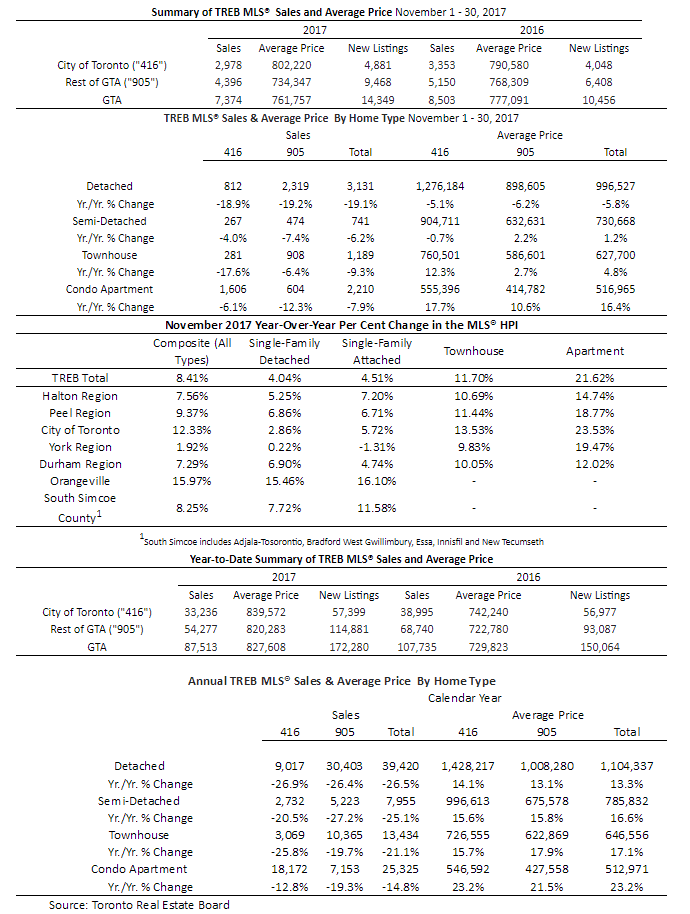
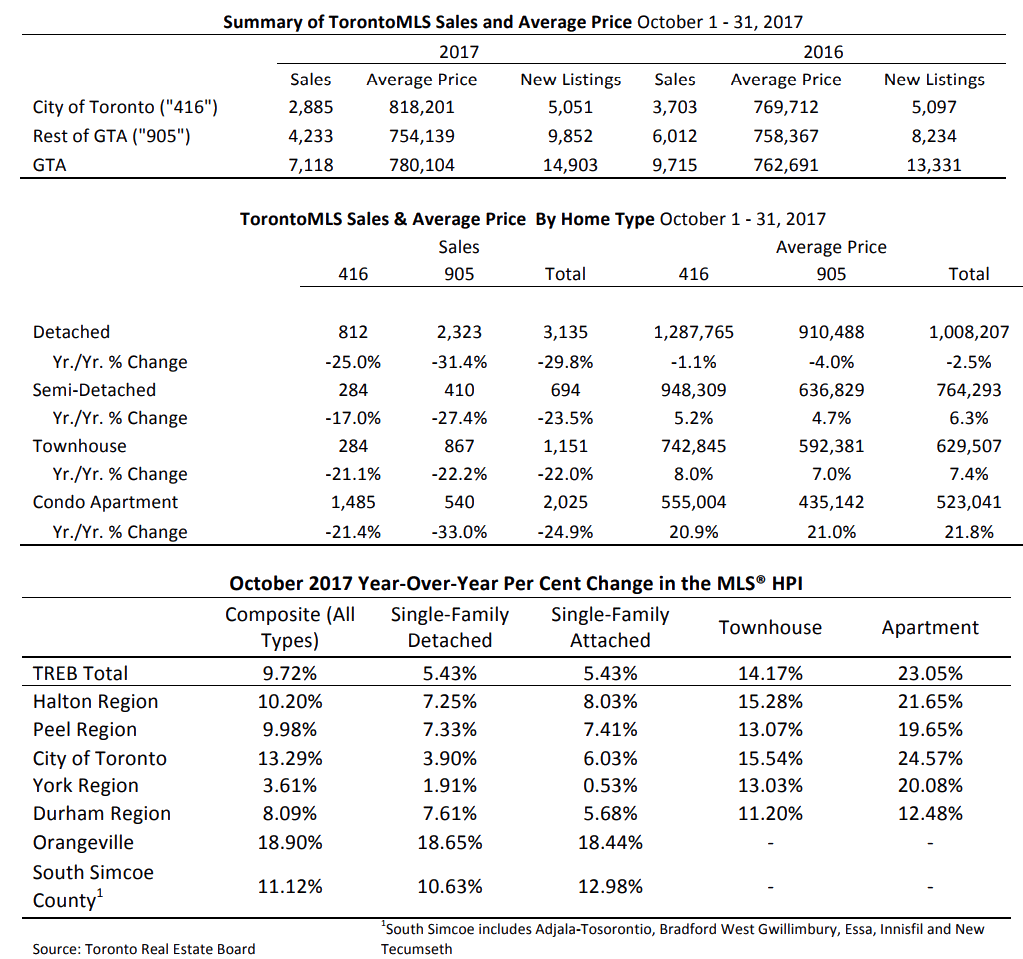
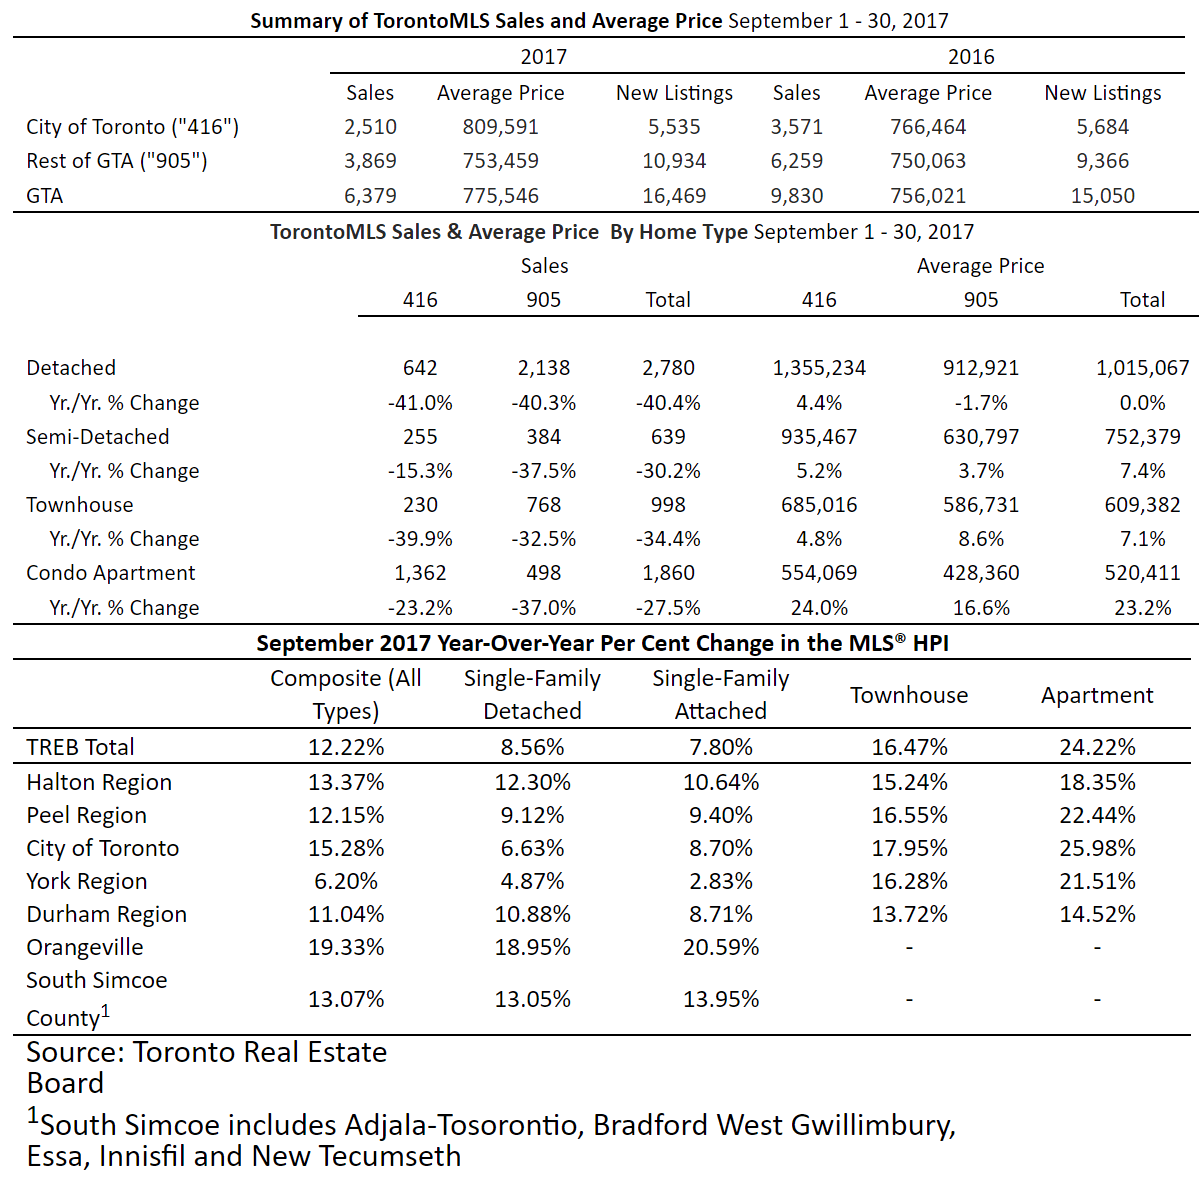
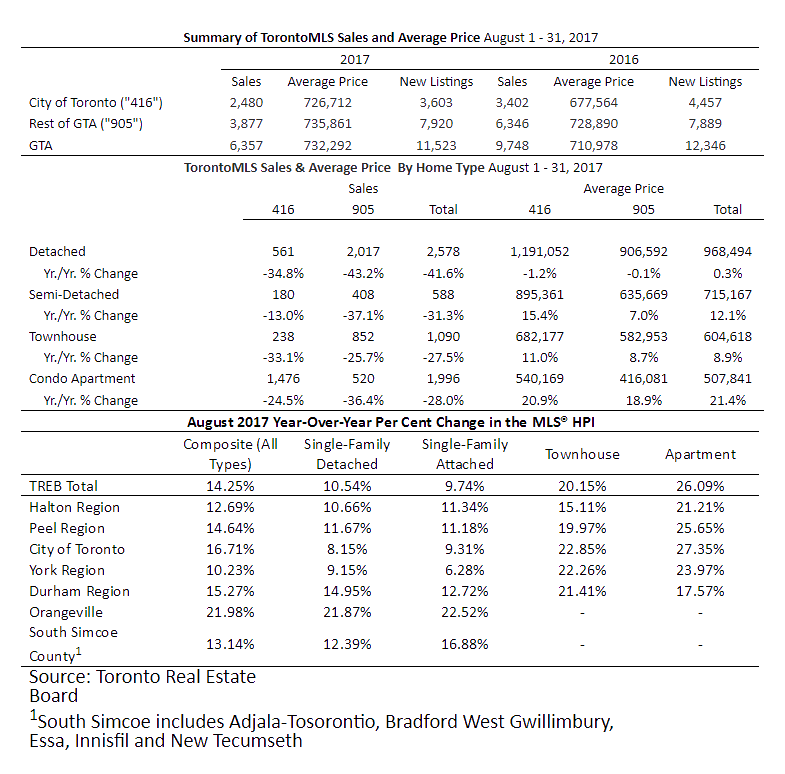
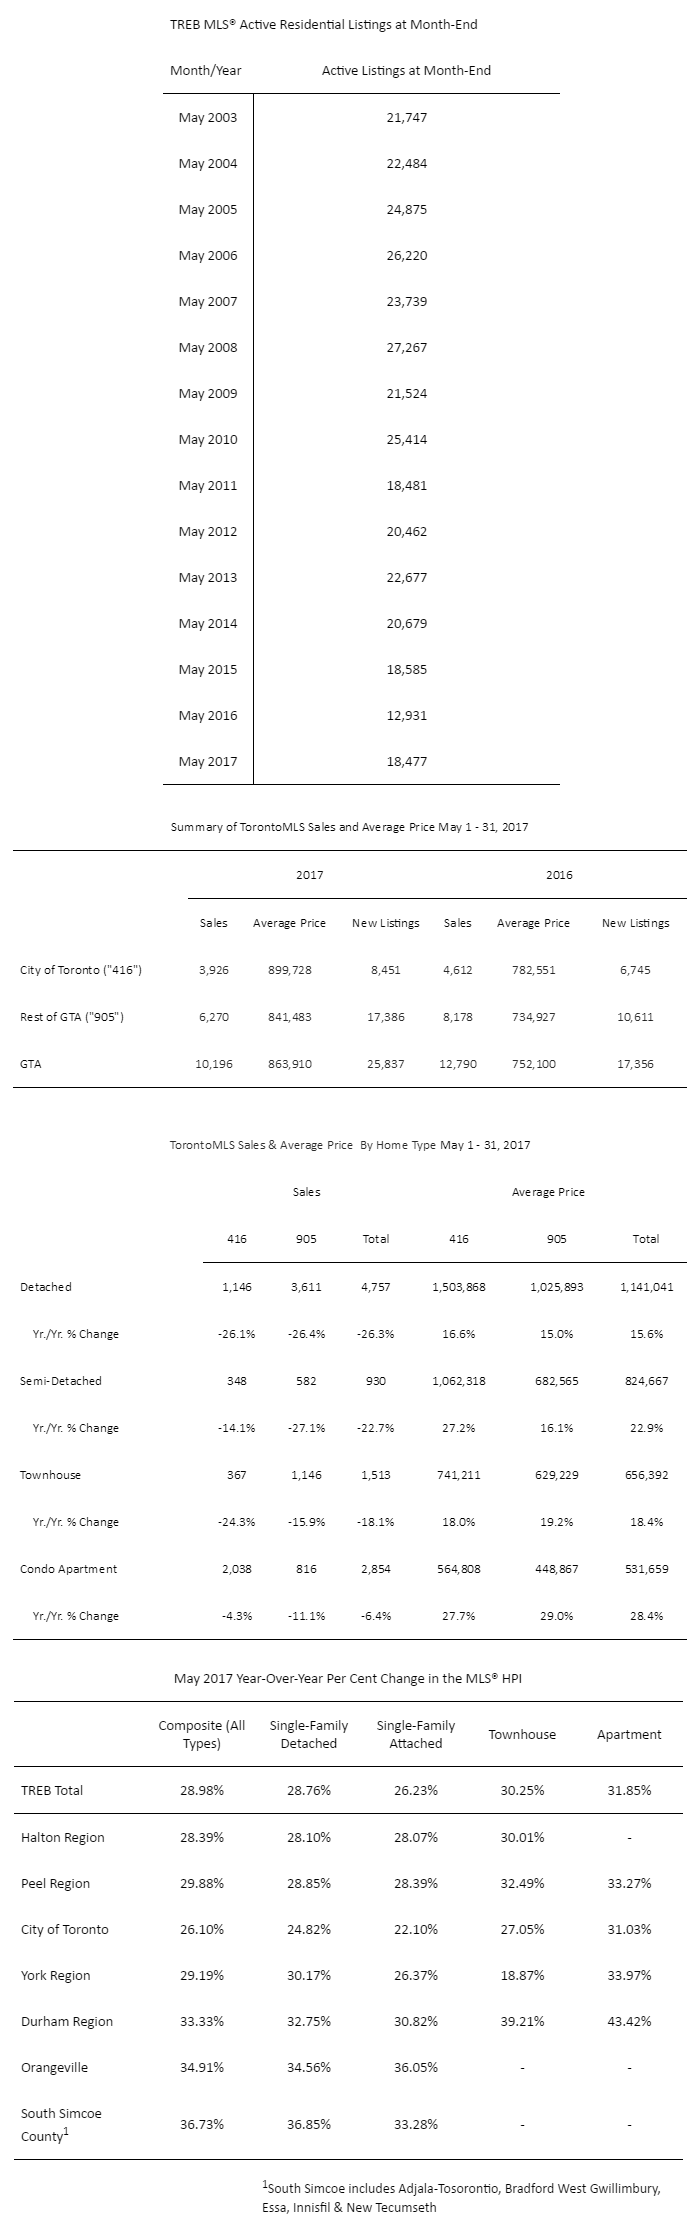
While the demand for ownership housing grew over the past year, new listings entered into TREB’s MLS® System in February were down on a year-over-year basis by 12.5 per cent to 9,834. This continues a pattern we saw throughout much of 2016, with the sales trend pointing up while the listings trend has been down, which has resulted in a contraction of the inventory of homes available for sale. TREB’s average months of inventory trend for February was at one month, while in many neighbourhoods across the GTA, inventory can now be measured in weeks rather than months.
“The listing supply crunch we are experiencing in the GTA has undoubtedly led to the double-digit home price increases we are now experiencing on a sustained basis, both in the low-rise and high-rise market segments. Until we see a marked increase in the number of homes available for sale, expect very strong annual rates of price growth to continue,” said Jason Mercer, TREB’s Director of Market Analysis.
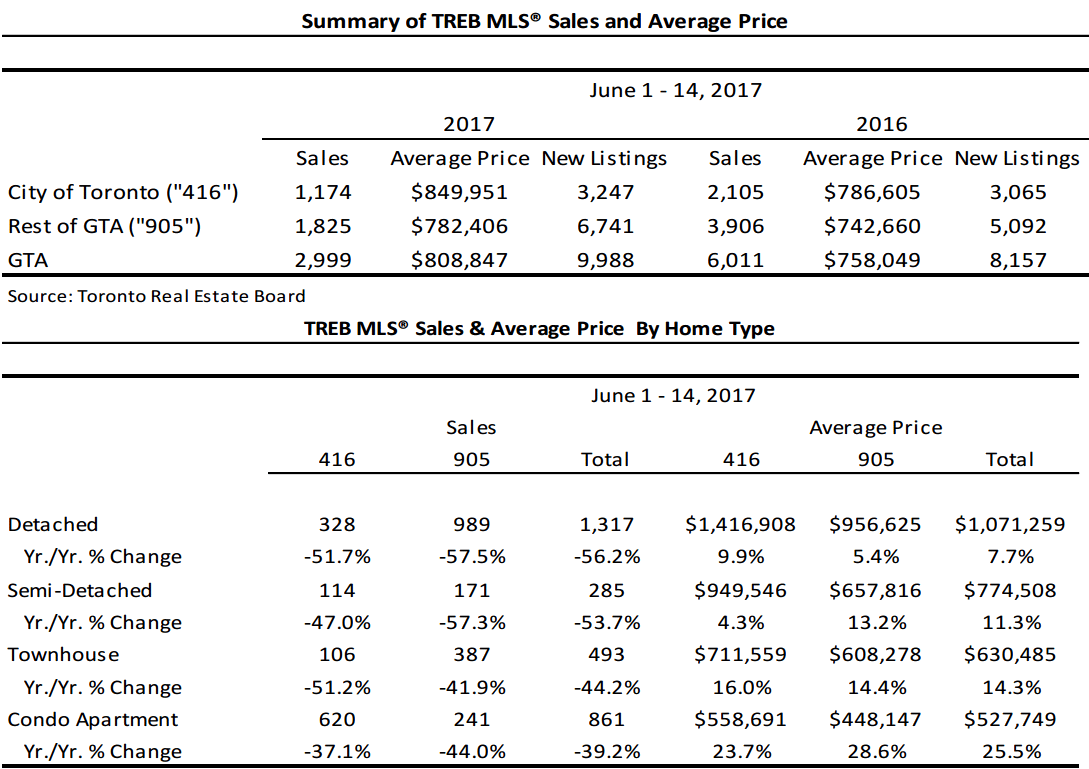
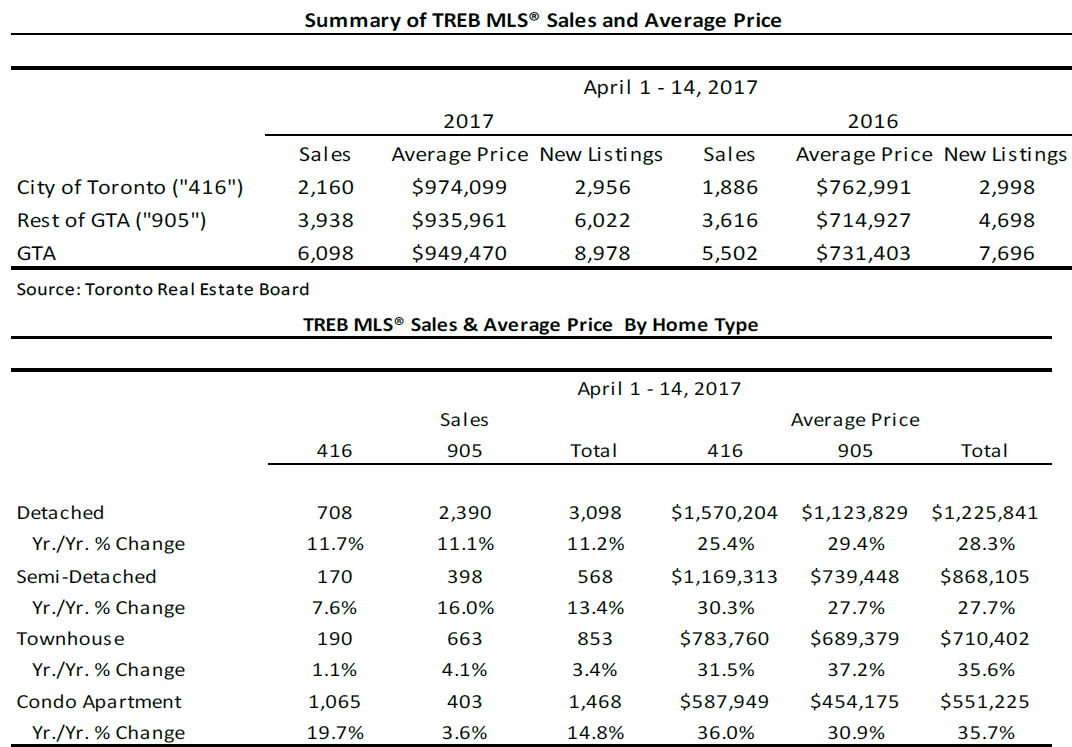
The MLS® HPI Composite Benchmark Price was up by 23.8 per cent compared to February 2016. Similarly, the average selling price was up by 27.7 per cent year-over-year to $875,983. Annual rates of price growth continued to be strongest for low-rise home types, particularly detached houses. Growth rates for condominium apartment prices were also in the double digits, likely a result of strong demand from first-time buyers.
“Over the past year, we have reached a point where government policies that target only the demand side of the market, whether we’re talking about foreign buyers or further changes to mortgage lending guidelines, will not be enough to balance market conditions and moderate the pace of price growth,” continued Mercer.
“In 2017, policymakers at all three levels of government must turn their attention to the supply of homes available for sale. They should consider revisiting land-use designations in built-up areas to allow for a greater diversity of home types, streamlining development approvals and permitting processes, and looking at ways to incentivize landowners to develop their land,” suggested Cerqua.
A panel of industry experts was on hand at TREB’s recent Economic Summit, which served as a launch for TREB’s Market Year in Review & Outlook Report 2017, to share their take on the growing housing supply crisis in the GTA. Discussing the nature and scope of the crisis as well as possible solutions, the implications were clear: there is a housing supply crisis and the only way to solve it would be coordinated and innovative solutions by the government, private and not-for-profit sectors.
This and other issues, including a market outlook for 2017 and the impact of transit infrastructure and housing affordability were discussed at the Economic Summit and are touched on in the report. To learn more about the Economic Summit or to read a copy of TREB’s Market Year in Review & Outlook Report 2017, please visit www.TREBhome.com