

The Stabilization of Home Prices Confirmed In May
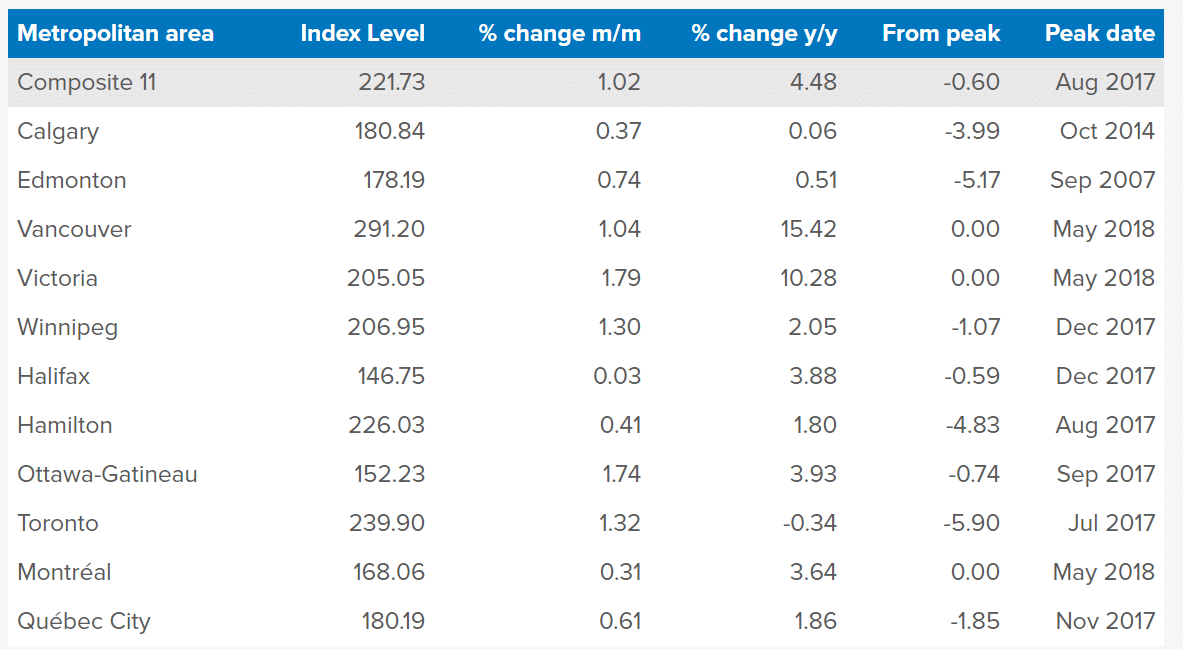
In May the Teranet–National Bank National Composite House Price IndexTM was up 1.0% from the previous month. This confirms the index stabilization following the downward trend that prevailed over the second half of 2017. The last monthly gain is one tick less than the May average of 1.1% over the 20 years of index history. The monthly advance was led by the metropolitan markets of Victoria (1.8%), Ottawa-Gatineau (1.7%), Toronto (1.3%), Winnipeg (1.3%) and Vancouver (1.0%). The rise of the Toronto index matched its historical average for May. The rise of the Ottawa-Gatineau index was not enough to make up its cumulative decline over the previous four months. There were smaller monthly advances in the indexes for Edmonton (0.7%), Quebec City (0.6%), Hamilton (0.4%), Calgary (0.4%) and Montreal (0.3%). The index for Halifax was flat.
In Toronto the condo resale market remains tight.[1] In May the condo subindex was up 11.1% annualized from the beginning of the year compared to only 0.8% annualized for all other housing types. The recent advance of the Vancouver index is also due primarily to its condo segment, whose subindex in May was up 17.5% annualized from last September compared to 4.9% for other housing types. Of the 11 markets in the composite index, Vancouver, Victoria and Montreal were the only ones whose indexes rose to a new high in May. In the Montreal market, existing-home sales in the first five months of the year were the best in eight years for those months. In May the countrywide composite index was 0.6% below its peak of last August. The metropolitan area furthest from its previous peak was Toronto, down 5.9% from its reading of last July.
Because of a rapid advance from May to August last year, the composite index was nevertheless up 4.5% from a year earlier. It was the smallest 12-month rise since June 2015 and an 11th consecutive deceleration from last June’s record 12-month gain of 14.2%. The increase was led by Vancouver (15.4%) and Victoria (10.3%), the only two markets whose gains exceeded the countrywide average. The 12-month rise was 3.9% in Ottawa-Gatineau, 3.9% in Halifax, 3.6% in Montreal, 2.1% in Winnipeg, 1.9% in Quebec City, 1.8%
[1] Note on methodology: The current-month data used to calculate the index are those of closed sales registered in the provincial land registry. The published indexes of the 11 metropolitan markets entering into the Teranet–National Bank Composite House Price Index™ are moving averages of the last three months of raw indexes, a procedure that smooths out month-to-month fluctuations. More granular monthly data are available upon request, possibly subject to subscription fees. For our full methodology, please visit www.housepriceindex.ca
Marc Pinsonneault
Senior Economist
Economics and Strategy Group
National Bank of Canada


Leave a Reply
Want to join the discussion?Feel free to contribute!